Ripple’s XRP is under heavy selling pressure after touching a recent high of $3.64. The sudden shift in momentum comes amid broader market uncertainty and a sharp dip in Bitcoin, triggering caution across altcoin markets.
As of now, XRP is trading at $3.11 with a 24-hour volume of $5.74 billion. Its market cap stands at $184.44 billion, showing a slight reduction as investors react to short-term market changes.
Price correction eyes $3 after losing key support
Crypto chartist Ali Martinez pointed out that $3.15 is a key support level for XRP. If the price breaks below this level, a correction toward $3 is likely. Such a move could offer a strategic entry for traders watching from the sidelines.

Despite the pullback, XRP whales remain active. On-chain data shows that over 60 million XRP were accumulated in the last 24 hours. This signals confidence among large holders and could help stabilize the price around key support levels.

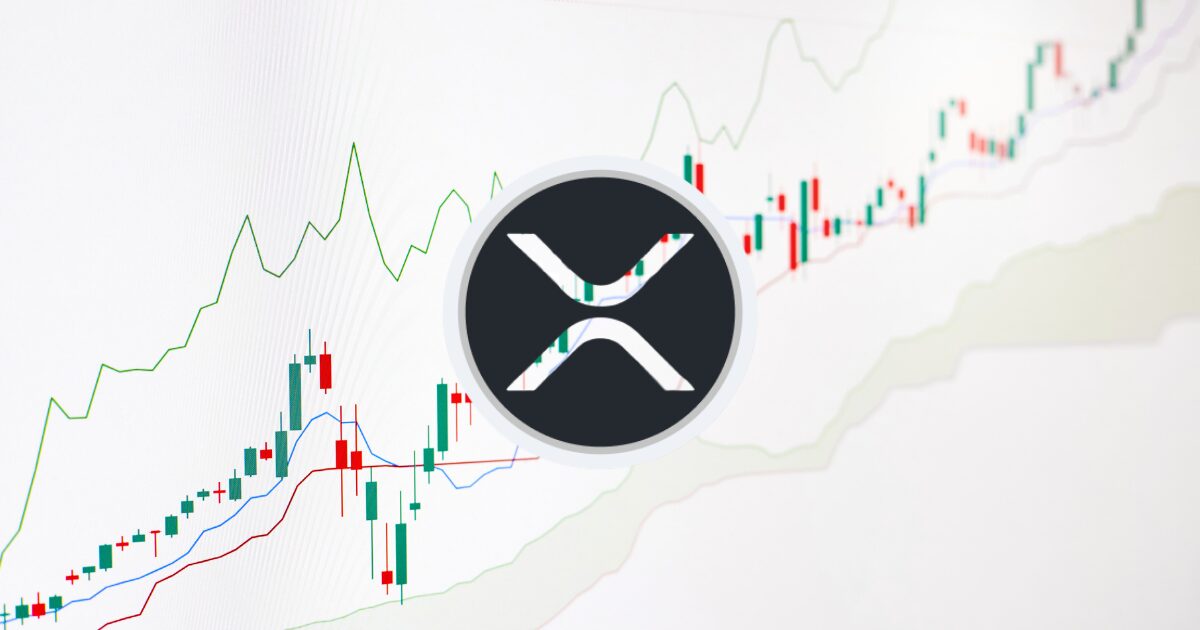
XRP technical chart holds bullish structure
The daily chart shows XRP remains above all major moving averages. The 20-day simple moving average (SMA) is now at $3.1689 and acting as short-term resistance.
Below that, the 50-day SMA is at $2.5910, the 100-day at $2.4362, and the 200-day at $2.4512. This upward stacking of moving averages confirms a bullish longer-term trend, despite the ongoing correction.
Bollinger Bands show a tightening price range. The upper band sits at $3.6627, the middle band aligns with the 20-day SMA at $3.1687, and the lower band stands at $2.6746. XRP has pulled back toward the middle band, indicating a cooling-off phase but not a trend reversal yet.

The Relative Strength Index (RSI) has slipped from 71.02 to 57.83. While no longer overbought, the drop shows a decline in buying strength. This positions XRP in a neutral zone, where further selling could take the token lower unless a rebound emerges quickly.
MACD flashes warning of bearish shift
Momentum indicators are showing early signs of a shift. The MACD (12,26) shows the MACD line at 0.16992, below the signal line at 0.22251. The histogram reading of -0.05260 confirms weakening bullish momentum.
If XRP fails to reclaim the $3.1689 level, it could fall toward the 50-day SMA at $2.5910 or the lower Bollinger Band near $2.6746.
However, the broader bullish outlook remains intact as long as XRP holds above the 100-day and 200-day moving averages. Any bounce from these zones may reignite buyer interest.