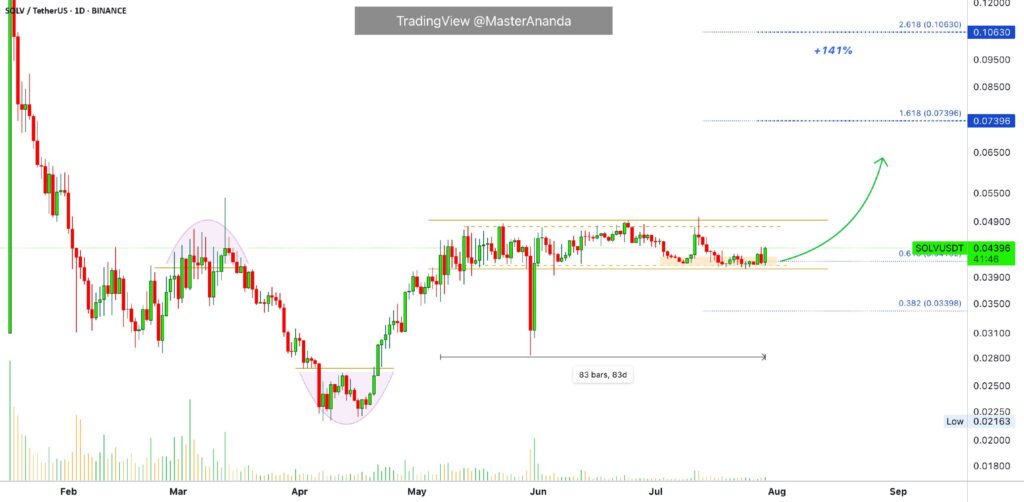
Solv Protocol (SOLV) has been moving sideways for over 80 days. But now, its chart is starting to show movement.
According to analyst Master Ananda, the narrow price movement is actually an early signal that buying pressure is starting to accumulate. Coincidentally, this all happened after the market crashed sharply in April.
Interestingly, this SOLV chart pattern is quite unusual. When an asset forms a price structure that rarely occurs, its movement is likely to be out of sync with the market. SOLV can rise when other assets are sluggish, or vice versa.
However, in this case, the price action occurred near the lower boundary of the range (support). This is usually a favorite area for opportunity seekers.

Solv Protocol gains momentum after BNB Chain backs the move
BNB Chain further confirms this is more than just technical speculation. On July 28, they announced the purchase of $25,000 worth of SOLV as part of a $100 million ecosystem fund.
This move is seen as validation that Solv Protocol plays a crucial role in Bitcoin’s (BTCFi) DeFi infrastructure. And the effect was immediate: trading volume rose 26.4% to $19.9 million in just one day. The price of SOLV also surged, posting a 6.2% increase in the last 24 hours.
Furthermore, Solv product adoption is also expanding. Through integration with Binance Earn, users can stake Bitcoin and earn SOLV rewards of up to 2% APR. And it can all be done directly from the Binance app, without the need to log in and out of other platforms. This clearly lowers the barrier to entry for users new to staking.
If the price can close above $0.04411 today, the potential for a breakout is wide open. An upward movement could occur in a matter of days.
CoinLore projects that a break above $0.0453 could see the price of SOLV rise to the next resistance level at $0.0497, with a chance of rising further to the third resistance at $0.0599.
However, the subsequent trend phase could last much longer. There are times when the price will retreat briefly before finally surging. But as long as technical and fundamental support remain in place, the opportunity remains open.
If this scenario pans out, the upside target from the current position could even skyrocket over 140%. This calculation refers to the Fibonacci Retracement technical tool. While not guaranteed, opportunities like this rarely come around. Not only that, this rare chart structure can present opportunities that are hard to find in other assets.

