Despite recent selling pressure, according to Ali Martinez’s chart, Solana is entering a tight consolidation phase.
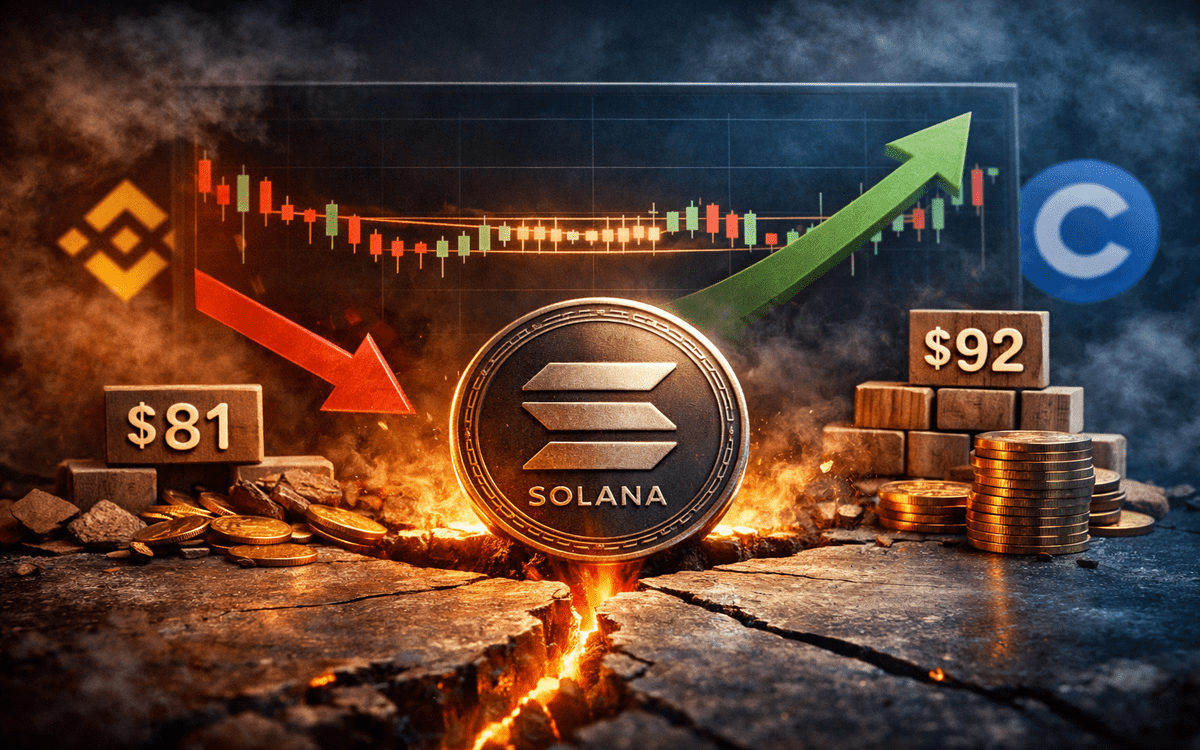
Price trades near $86, while volatility continues to shrink. The narrowing range between $81 and $92 shows buyers and sellers reaching temporary balance.
This compression often signals that a strong directional move could develop soon
This structure suggests the market is building pressure before a strong directional move. Traders are watching closely as momentum slowly stabilizes around this zone.
Such price compression often precedes sudden volatility expansion. A breakout above $92 could open the path toward $100 and possibly higher resistance levels.
Strong buying volume would be required to sustain this upside continuation. However, losing $81 support may trigger renewed selling pressure.
A breakdown could push SOL toward the $75 region if bearish momentum returns.
SOL price stabilizes near $85.06 after sharp pullback
Meanwhile, analyst Crypto Paykash noted that SOL recently has faced rejection near $88.78 before pulling back toward $84.30.
Buyers stepped in around $84.30, creating a short-term support base after the drop. Price now trades near $85.06 on the 15-minute chart and appears to stabilize.
The rebound from this level suggests buyers are cautiously regaining control.

Furthermore, the $84.50–$84.00 range remains a key support zone for the current structure.
Holding this area could allow a relief bounce toward $88.00–$88.30 resistance. The gradual sequence of higher candles signals improving short-term momentum.
However, a breakdown below $84.00 would likely invite renewed selling pressure. In that case, traders may watch for the next reaction from lower demand zones.
Solana price outlook
Looking at the 1-day Solana price chart, the token is trading near $86.03.
The trend remains bearish, with price forming lower highs and lower lows. The $84–$85 zone is acting as key support after the recent drop.
If this level breaks, the price may move toward $80. The nearest resistance sits around $90–$92, where sellers previously rejected the price.

The relative strength index (RSI) is around 47, showing neutral momentum and weak buying strength.
The MACD remains below the zero line but is slowly turning upward. The histogram shows fading bearish momentum, suggesting the selling pressure may be easing.