
Solana is trading within a narrow range as market participants wait for direction. Price action shows a balance between buyers and sellers after recent volatility.
Momentum remains limited, which keeps traders cautious in the short term. As a result, attention shifts toward key levels that could define the next move.
Solana range structure keeps price in check
Solana price is moving between clear support and resistance zones. According to BitGuru, the asset remains capped between $80 and $83.
This range formed after a sharp decline toward $77.5, where buyers stepped in quickly. The rebound that followed created a recovery, but it lacked strong momentum.
However, rejection near the $82–$83 area signals persistent selling pressure. Sellers continue to defend the upper boundary, which prevents a breakout.
Consequently, Solana price remains locked in consolidation rather than forming a new trend.
The $80–$81 zone now acts as a key midpoint within this structure. BitGuru noted that a break below this level could trigger a move toward $78 or lower.
This setup reflects consolidation after a decline, not a confirmed reversal. Therefore, traders continue to watch for confirmation before entering positions.
Trendline pressure and breakout levels in focus
SatoshiOwl highlighted $85 as a critical level for Solana price. A move above this level could shift momentum toward buyers.
Moreover, a successful reclaim may open a path toward $90, where previous resistance sits. At present, Solana is trading below a descending trendline, which adds pressure on price.
Despite this, higher lows around $79–$80 suggest early signs of strength. This pattern indicates that buyers attempt to challenge resistance again.
If Solana breaks above the trendline and holds, the market structure improves. SatoshiOwl stated that such a move would increase confidence in a recovery scenario.
On the other hand, rejection could confirm continued weakness. Losing the trendline may push price toward $78 or even $75.
Meanwhile, Satoshi Flipper pointed to a rising channel on the daily chart. This structure supports a broader uptrend despite recent pullbacks.
The lower boundary near $80–$82 acts as dynamic support. Mid-channel resistance stands near $92–$95, while the upper boundary approaches $100.
A breakout above $90 could drive price toward the top of the channel. However, weak momentum continues to limit upside progress for now.
Solana technical analysis
Solana is in a clear downtrend on the 1-day chart, with lower highs and sustained selling pressure.
The RSI hovers around the mid-40s, signaling weak momentum and no strong bullish reversal yet.
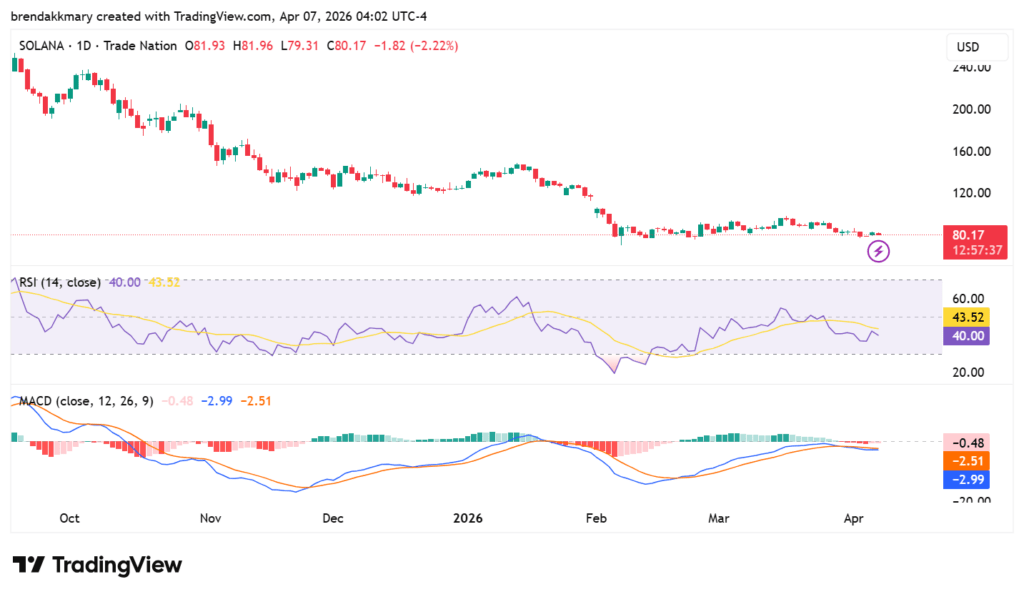
SOL 1-day price chart, Source: TradingView
The MACD remains below the signal line with negative histogram bars, confirming continued bearish momentum despite slight flattening.