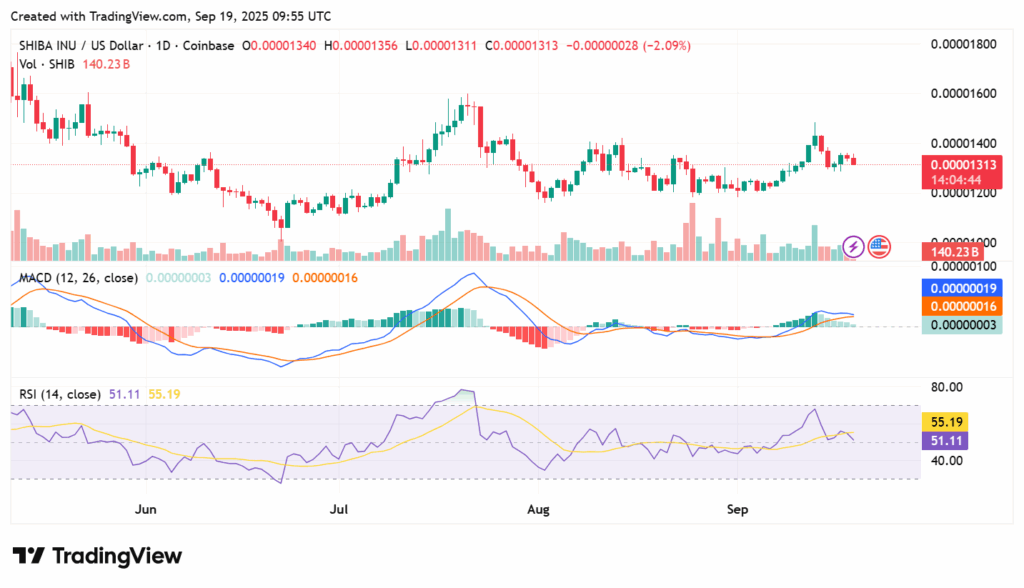
The crypto market is trading with a mix of red and green today, with the overall market capitalization hovering around $4.08 trillion. Shiba Inu is exchanging hands at $0.00001319 per token, down 1.91% over the past 24 hours. Over the past week, Shiba Inu has also decreased by 1.28%.

According to Mayen, the token’s price action is currently consolidating within a long-term descending triangle pattern that has been forming since its peak of $0.00008845 in October 2021.
With SHIB now approaching the extreme low point of this triangle, a decisive breakout is imminent. Mayen hinted at a massive move, supported by bullish momentum indicators, though he did not provide a specific price target or timeline.
Shiba Inu eyes new ATH with 568% surge potential,
Community analyst Shib Spain echoed this sentiment, pointing to SHIB’s support zone between $0.00001270 and $0.00001347 as a potential springboard for a rally. He speculated that a rebound from this critical zone could ignite a strong uptrend, possibly carrying the token toward a new all-time high.
To achieve this, Shiba Inu would need to surge by 568% from its current level to surpass its October 2021 peak of $0.00008845. Such a move would mark a significant recovery and reaffirm SHIB’s potential as a high-volatility meme token capable of rapid rallies under favorable market conditions.
Technical analysis– Will SHIB price rally continue further?
Looking at the daily technical indicators, the Relative Strength Index (RSI) indicator is hovering around 51.11, indicating that the market is neither overbought nor oversold. SHIB is in a neutral-to-positive zone, suggesting there’s still room for upward movement before hitting overbought levels.

The MACD (Moving Average Convergence Divergence) is showing a bullish signal, as the blue MACD line has crossed above the orange signal line, supported by rising green histogram bars that reflect strengthening upward momentum. This suggests that buyers are regaining control and could push the price higher in the short term.

