
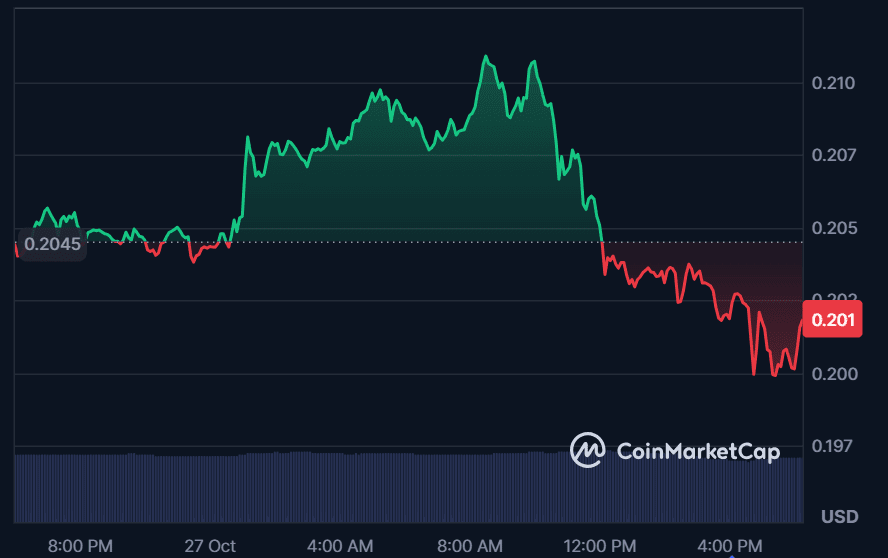
SEI’s price dropped to around $0.200 after facing rejection near the $0.210 level, signaling strong selling pressure.
The coin briefly gained momentum early in the day but failed to sustain higher highs, leading to a steady decline.
Overall, the bearish momentum dominates as buyers struggle to defend the $0.200 support zone.
As of this writing, the Altcoin is trading at around $0.201 with a 24-hour loss of 1.17%.
Recent market data from analyst Ali Martinez, SEI appears to be setting up for a strong rebound after finding solid support around the $0.20 level.
The price has been moving within an ascending parallel channel, suggesting that the overall market structure remains bullish despite recent corrections.
Martinez noted that this lower channel boundary has historically acted as a springboard for previous rallies, indicating a potential recovery phase could soon unfold.
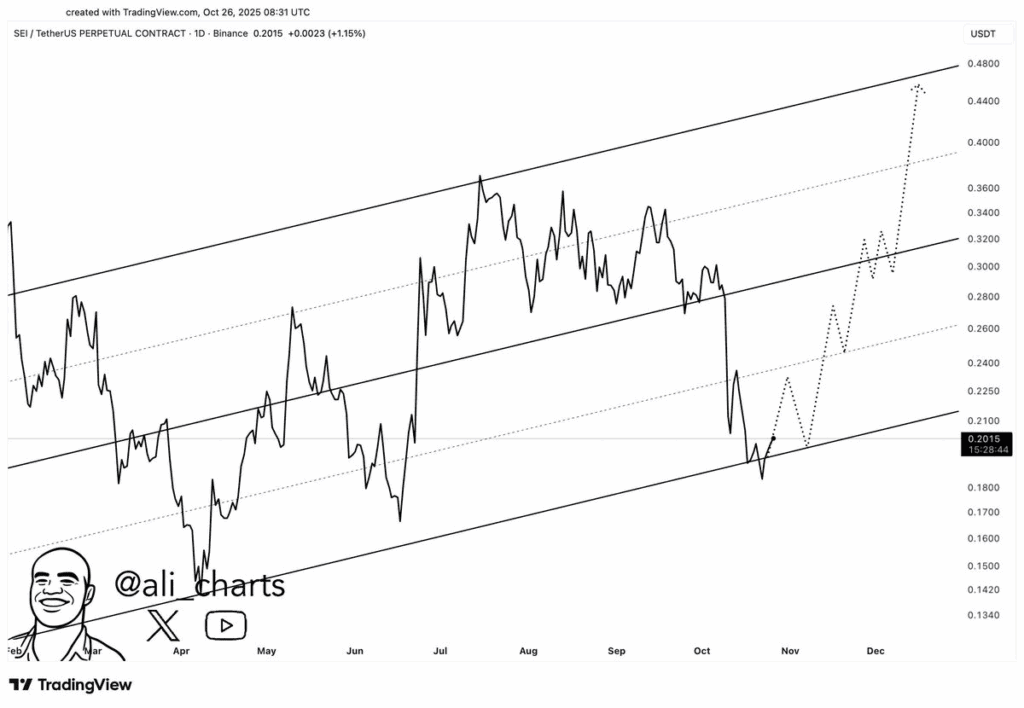
If SEI maintains this support, a gradual climb toward the mid-range resistance around $0.30, followed by a possible breakout toward the upper boundary near $0.44.
Such a move would align with the channel’s pattern of higher highs and higher lows, signaling renewed momentum and investor confidence.
However, a sustained close below $0.20 could invalidate this bullish setup and delay the expected uptrend.
SEI price faces resistance at $0.21 as bears maintain control
In the 1-day SEI chart, the price is trading around $0.200, reflecting a bearish trend after repeated failures to hold higher levels.
The market has been consolidating near its support zone around $0.19, which has been tested multiple times, indicating a potential accumulation area.
On the upside, the nearest resistance level lies at $0.21, where sellers previously stepped in to cap the recovery attempts.
The overall structure suggests that SEI remains under pressure unless it breaks above this resistance level with strong volume.
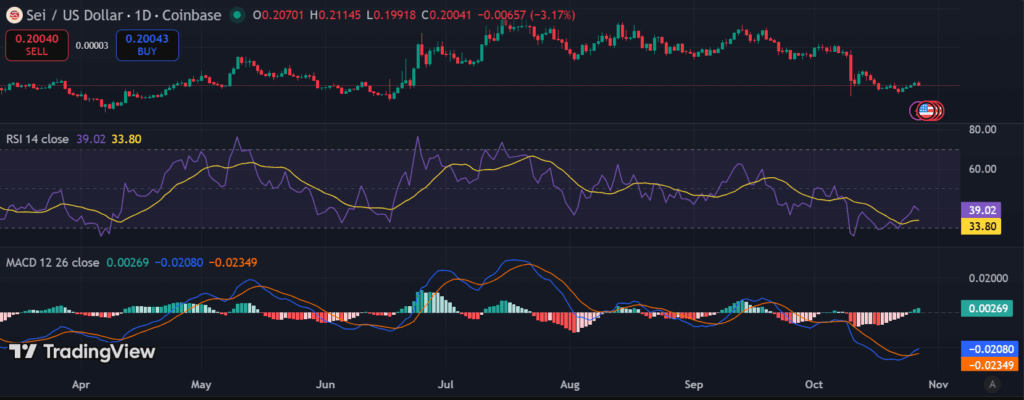
The RSI is currently at 39.02, showing weak momentum and indicating that SEI is still in bearish territory.
Meanwhile, the MACD is slightly above the signal line, with a minor bullish crossover, suggesting early signs of a possible reversal if buying pressure increases.