
Over the week, Pudgy Penguins (PENGU) dropped from $0.0252 to around $0.0220, marking a decline of about 13%.
The price exhibited consistent bearish momentum, with minor recovery attempts following midweek lows.
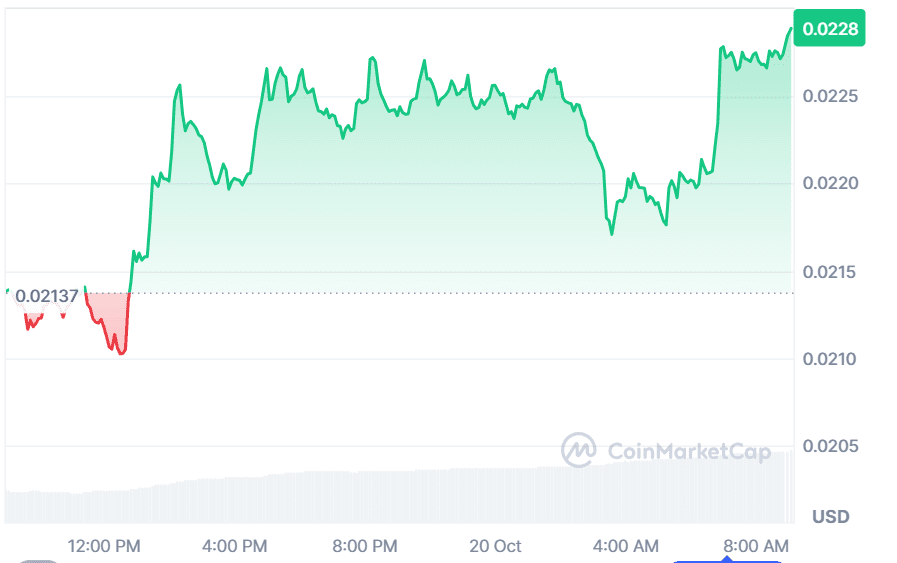
As of today, Pudgy Penguins is trading around $0.0228, marking a noticeable recovery from the $0.0214 level earlier.
The token has shown increased buying momentum, pushing prices higher after a brief consolidation. If bullish sentiment continues, PENGU could test the next resistance near $0.0230 soon.
As of this writing, the Memecoin is exchanging hands at around $0.02288 with a 24-hour gain of 7%.
Recent data from analyst Ali, is showing that PENGU token has been moving in a clear downtrend, creating lower highs and lows.
The recent candles are showing price stability near $0.0210, hinting that selling pressure may be fading. This level has become a strong support zone where buyers are defending.
The TD Sequential indicator has printed a buy signal, marked by a count of 9. This pattern suggests that the bearish phase could be ending. It often signals a potential trend reversal when sellers lose momentum.
Volume has also been decreasing, which supports a shift from selling to accumulation. This indicates that traders might be preparing for a new upward phase.
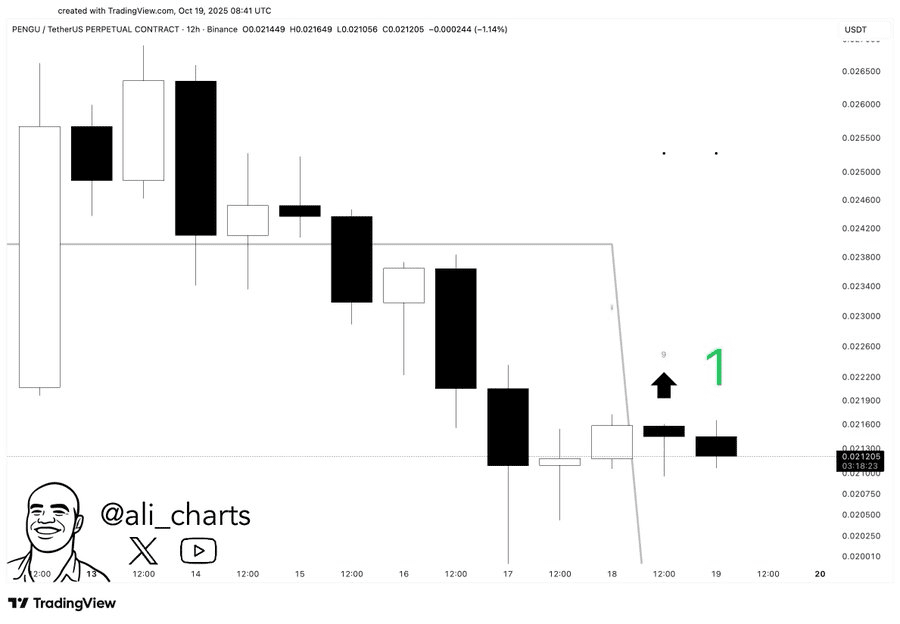
If PENGU manages to close above $0.0219, a short-term recovery could follow. The next resistance levels stand at $0.0238 and $0.0242.
However, failure to break above $0.0219 may keep the token in consolidation. This would delay any meaningful breakout and extend sideways trading.
Technical analysis- PENGU shows MACD reversal signs
Looking at 1-day chart, PENGU price has been in a downward trend, but the recent candles suggest price stabilization near $0.0216 support.
The next resistance is around $0.0239, which the token must break for a potential reversal. A close above this level could confirm a short-term bullish recovery.
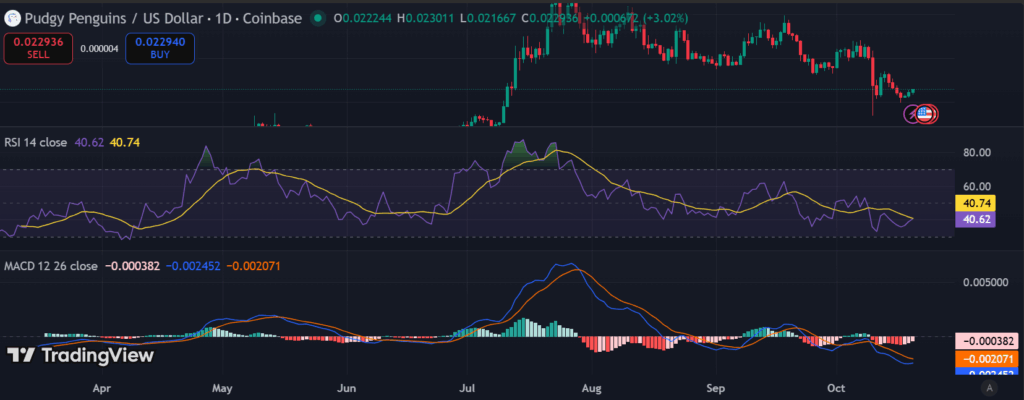
The RSI, currently near 40, shows that PENGU is in a neutral-to-oversold region. This means sellers are still active, but downward momentum is fading.
The MACD indicator remains in the negative region, with both the MACD line and the signal line below the zero line. This shows that bearish sentiment still dominates the market.