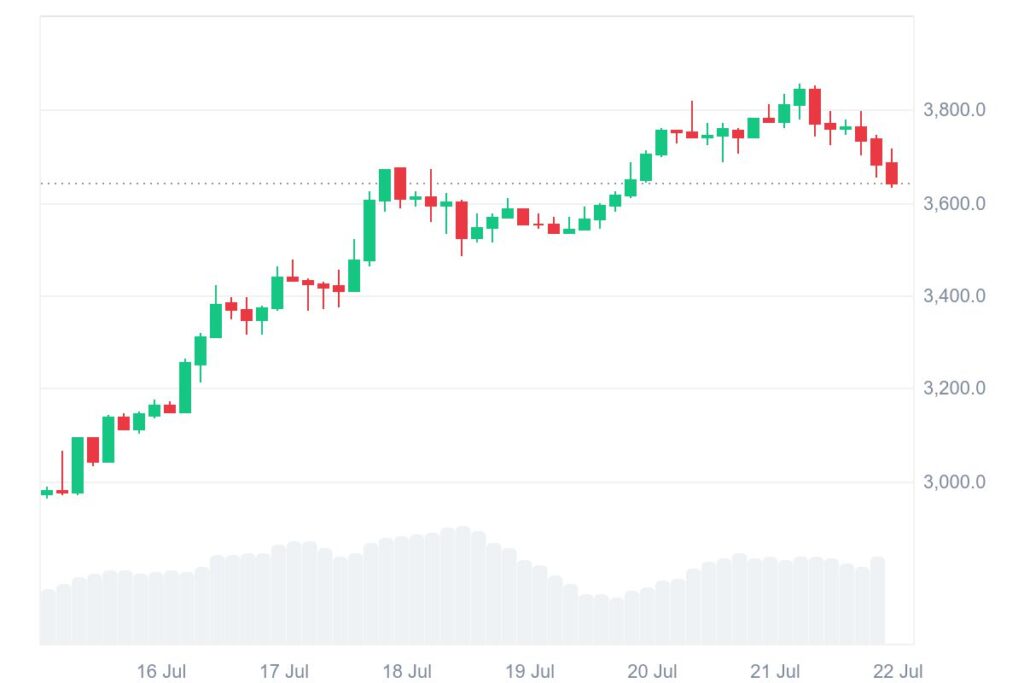
Ethereum (ETH) is showing signs of a minor cooldown after a solid rally that took prices above $3,700. At the time of writing, ETH is trading at $3,676, down 4.32% in the last 24 hours. Despite this slight pullback, market indicators suggest that the uptrend is far from over.

Ethereum RSI hits overbought levels, signaling short-term correction
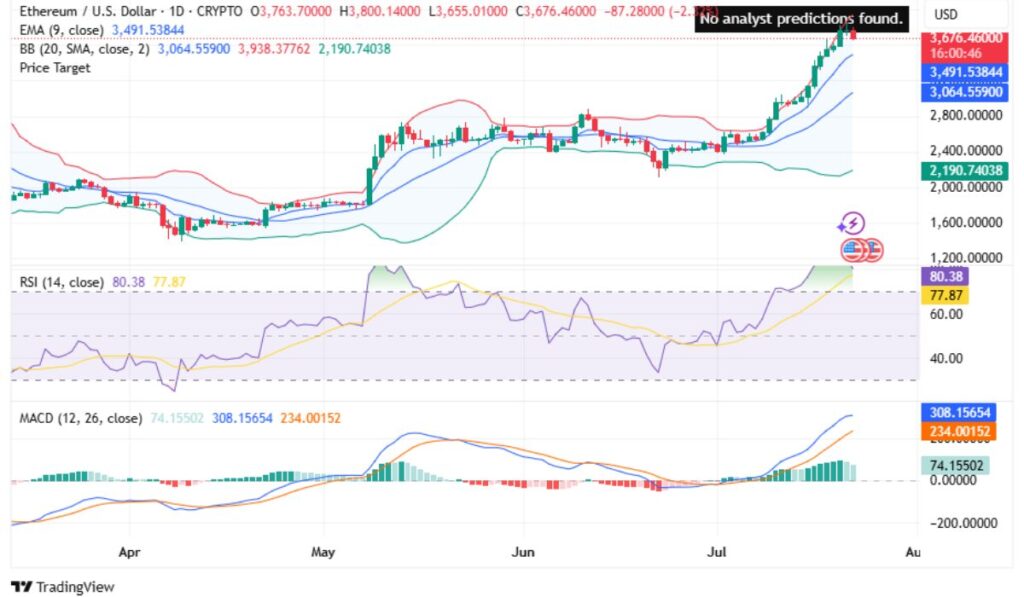
According to the Tradingview daily chart, Ethereum’s Relative Strength Index (RSI) is hovering around 80.38, placing the asset in overbought territory.
This typically signals a possible short-term consolidation or mild correction before continuation. However, price action remains well above the 9-day EMA at $3,491, suggesting that buyers are still in control.

The MACD indicator also supports bullish momentum, with the MACD line clearly above the signal line. This signals continued upward pressure, even though a cooling phase may be underway. Key support zones are currently at $3,491 and $3,064, while resistance lies in the $3,800–$3,900 region.
Ethereum derivatives metrics show strong market interest
Ethereum’s derivatives market continues to show strength, with trading volume rising by 9.98% to $147.80 billion, signaling increased activity from traders. At the same time, open interest climbed 0.91% to $57.90 billion, indicating that new positions are being added rather than closed.

Charts show that open interest and volume are climbing in sync with the price, which typically reflects solid backing for the trend. In short, Ethereum’s bullish breakout is being supported by real volume and consistent market participation.
The OI-weighted funding rate remains stable at 0.0117%, reflecting a balanced sentiment in the market where long positions dominate without excessive leverage. These figures suggest a healthy and sustained interest in Ethereum’s ongoing price action.

The OI-weighted funding rate continues to hold slightly positive without extreme spikes. This implies that traders are largely positioned long, but without excessive leverage. Stable funding in an uptrend points to a healthy market, where bullish positions are being sustained with confidence.
What’s next for ETH?
Despite the current RSI reading hinting at a near-term pause, the overall market structure remains bullish. As long as ETH holds above its 9-day EMA and key support at $3,064, the trend favors continuation toward higher levels.
If bulls regain momentum, Ethereum could retest resistance at $3,800 and potentially aim for $4,000 in the short to medium term. Derivatives data and technical signals both suggest the recent pullback is more of a cooldown than a trend reversal.

