
Ethereum is showing renewed momentum after breaking a key resistance zone, drawing attention from both spot and derivatives markets.
Price action has shifted upward in the near term, supported by growing bullish positioning in futures.
However, market signals remain mixed as analysts question the strength of the recovery. The broader outlook still points to potential downside risks later in 2026.
Ethereum breakout faces key test above $2,200
Ethereum moved above the $2,150 to $2,200 resistance zone, according to data shared by analyst Ted Pillows on X.
The chart showed ETH trading near $2,257 against Tether on the daily timeframe. It also identified $2,400.73 and $2,624.07 as the next resistance levels if the breakout holds.
Ted Pillows stated that Ethereum must stay above $2,200 to maintain its near-term structure. He explained that holding this level could allow the price to retest last month’s high.
The chart outlined a potential path toward $2,400 first, followed by a move to $2,624.
However, he cautioned that the breakout does not confirm a broader trend reversal. He noted that Ethereum could still print new lows in the second or third quarter of 2026.
This view suggests the current move may remain a temporary recovery within a wider weak trend.
The chart supported that outlook by showing Ethereum well below earlier highs near the top range. It also marked a lower support zone between $1,750 and $1,800. This area could come into focus if the breakout fails.
For now, the $2,200 level remains critical. A sustained hold above it may support further upside. A drop below it could weaken the recovery and shift attention back to lower support.
Ethereum futures activity signals rising bullish exposure
At the same time, Ethereum futures market activity has increased, according to data shared by X user CW.
The post indicated that fund inflows into ETH futures are rising again. It also showed that net long positions and open interest are both climbing.
CW explained that rising open interest reflects a growing number of active futures contracts. He added that the increase alongside net longs suggests traders are adding new bullish exposure. This pattern often signals improving sentiment in the market.
However, he clarified that higher open interest does not guarantee price continuation. It only indicates that leveraged positions are building.
If Ethereum fails to hold key support, those positions could unwind quickly.
The data suggests that traders are leaning toward further upside in the near term. Still, the outcome depends on spot price strength and support stability.
Ethereum must hold above key levels to sustain momentum and avoid renewed downside pressure.
Ethereum holds steady near $2,186 as momentum slowly improves
Ethereum price is moving sideways after a sharp decline earlier in the chart. Price is currently trading around $2,186, showing limited short-term volatility.
Recent candles suggest consolidation as the market stabilizes near this level.
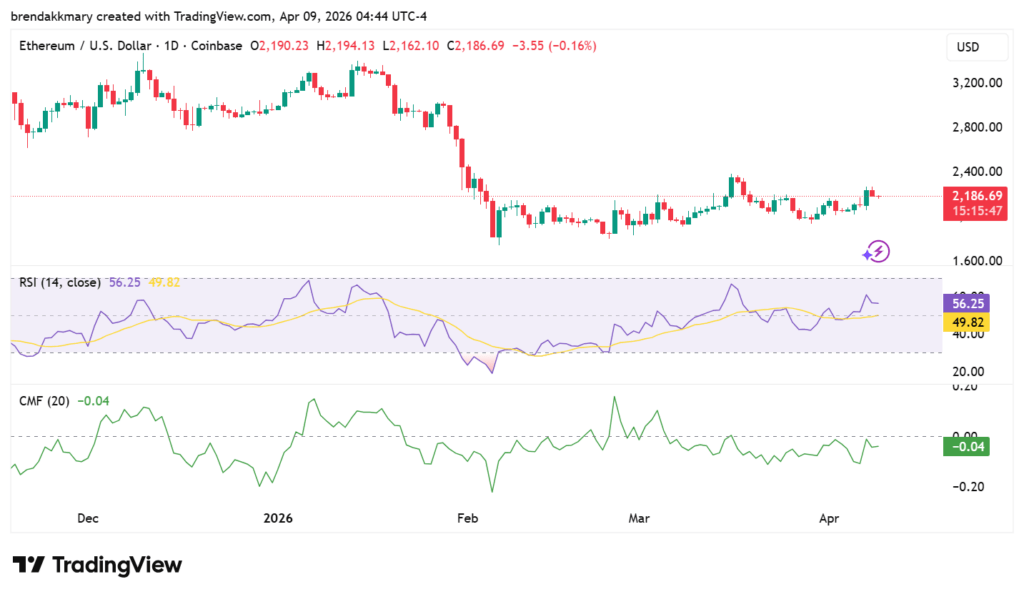
The Relative Strength Index sits near 56, indicating moderate bullish momentum.
The Chaikin Money Flow remains slightly negative near -0.04, showing weak capital inflow.
Together, the indicators suggest cautious buying pressure while overall momentum slowly strengthens.