Dogecoin has been trading in a tight range between $0.236 and $0.242, exhibiting sideways momentum with frequent fluctuations. The price briefly dipped below $0.236 on a couple of occasions but quickly recovered, highlighting strong short-term support.
Over the past week, it declined by 9.08% with a market capitalization of $36.39 billion. As of this writing, DOGE is exchanging hands at around $0.2409 with a 24-hour gain of 0.86%.

Dogecoin holding strong at 3-month support trendline
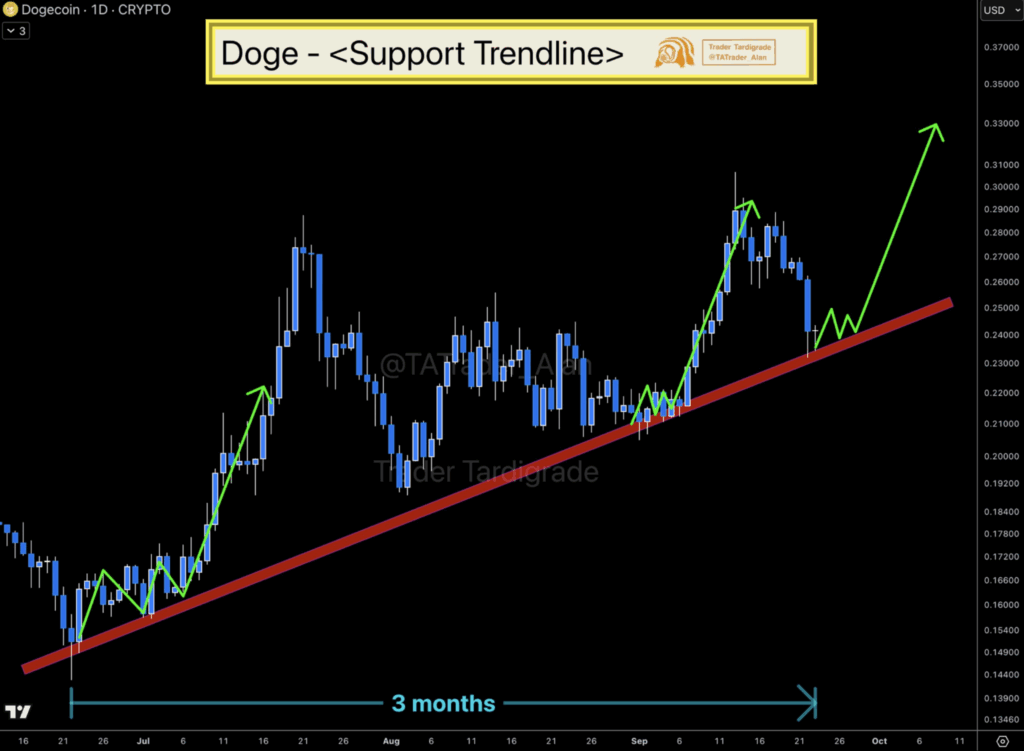
According to analyst Trader Tardigrade, Dogecoin is currently testing a key 3-month support trendline, which has been guiding its upward momentum since mid-June.
The chart shows that each time DOGE has retraced to this support, it has managed to bounce back and continue its upward trajectory. This consistent pattern suggests that the trendline is acting as a strong foundation for the ongoing bullish structure.
If the support holds, the projection points toward a potential rebound toward $0.30 and beyond, as highlighted by the upward green path in the chart. This setup indicates that Dogecoin’s broader trend remains bullish despite short-term corrections.
A break below the trendline, however, could invalidate this outlook, but as long as DOGE respects this level, traders may expect a continuation of the upward climb.

Dogecoin enters key buy zone near support levels
Market expert Ali Martinez highlights that Dogecoin is currently trading within a rising trend structure, supported by a long-term ascending trendline and capped by strong resistance around the $0.29–$0.30 zone.
DOGE is sitting in a favorable “buy zone,” close to support levels where downside risk appears limited.
Martinez notes that if Dogecoin can break and sustain a move above the $0.29 resistance, it could trigger a bullish rally toward the $0.32–$0.35 range in the short term.
Before breaking past Martinez’s resistance at $0.29, CoinLore notes that the memecoin must first break the resistance at $0.2426, $0.2537, and $0.2660.
In the broader outlook, this breakout could pave the way for a continued surge, with upside targets projected as high as $0.50, provided market momentum and sentiment remain supportive.
Technical analysis: Will the DOGE price rally continue further?
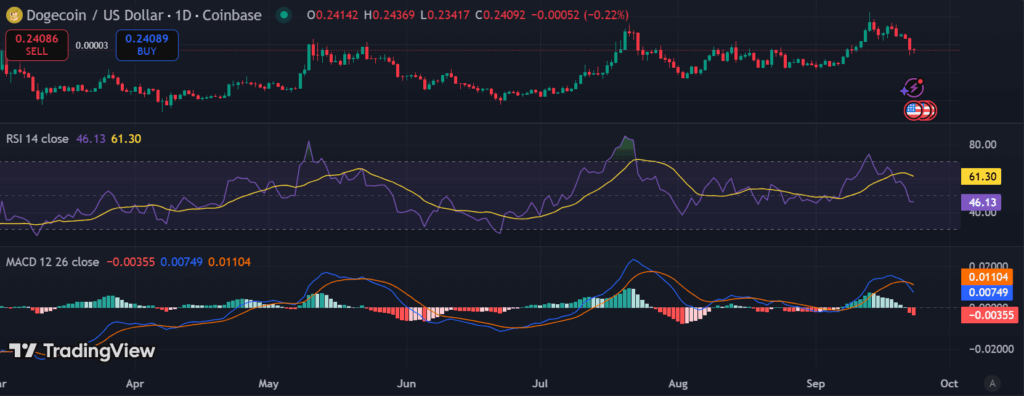
The MACD shows the MACD line (0.00977) crossing below the signal line (0.01193) with a red histogram, confirming a bearish crossover.
This adds further weight to the downside risk in the short term, pointing to possible continuation of the correction unless buyers re-enter around support levels.

The RSI has dropped to 46.31, showing weakening bullish momentum as sellers gain control. This signals that DOGE is not oversold yet but leans bearish with room for further downside.

