Dogecoin (DOGE) has traded sideways for a while, fluctuating between $0.23 and $0.24 with limited momentum. However, a recent bullish breakout has driven the price higher, breaking past key resistance.
The token is currently trading at around $0.255 up by 4.17%, exhibiting clear upward momentum.

Crypto analyst Cantonese Cat argues Dogecoin could hit $4 this cycle, using Elliott Wave theory, Fibonacci levels, and logarithmic charting.
He sees the current move as Wave Five, following textbook retracements in Waves Two, Three, and Four. Based on Fibonacci extensions, his primary target sits around $4.13, within the 1.272–1.618 range.
He also points to recurring cup-and-handle patterns as signs of long-term accumulation. While he notes alternative outcomes, such as a stall near $0.76 or a softer move toward the 1.272/1.414 zone, he maintains that clearing $0.33 would validate higher targets.
In his view, liquidity dynamics and cycle structure make a multi-dollar rally credible.
Dogecoin breakout signals fresh bullish momentum
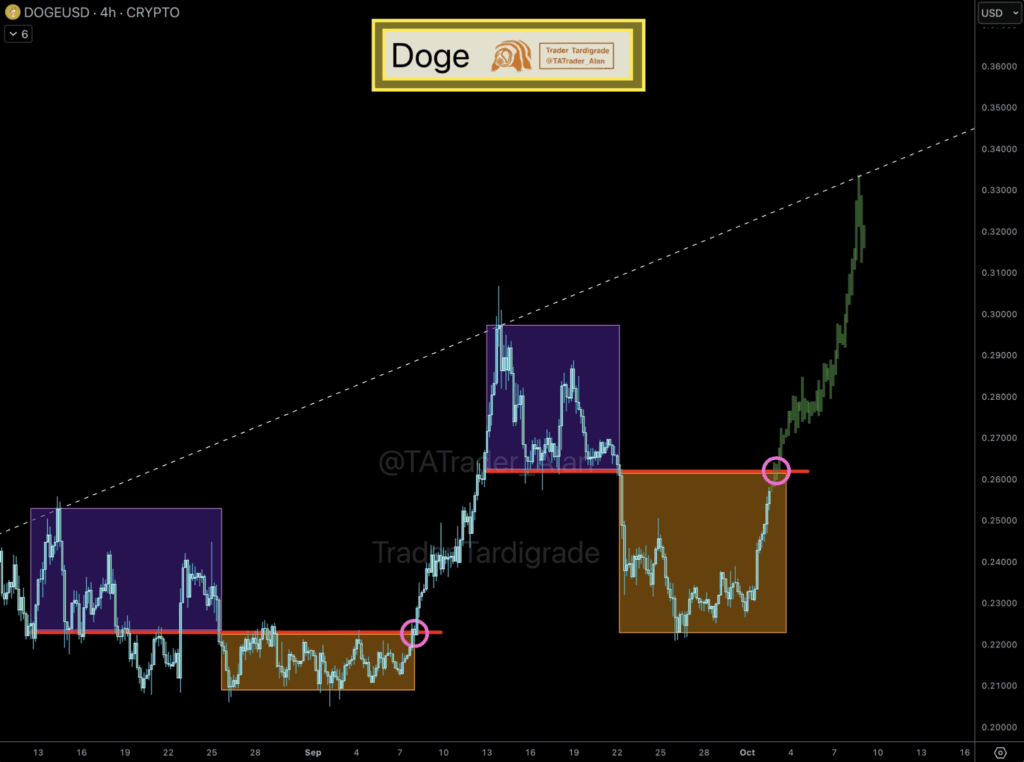
Analyst Trader Tardigrade’s chart highlights Dogecoin’s repeated pattern of consolidation followed by sharp upward breakouts.
Each accumulation zone, marked in colored boxes, shows price stabilizing around a horizontal support level before a strong bullish surge lifts it higher.
This cycle has repeated multiple times, with the latest breakout pushing DOGE above the $0.26 resistance zone, now turning it into support.
The pattern suggests a stair-step structure, where Dogecoin builds a base, consolidates, and then rallies to higher levels.

With the current move accelerating past $0.30, the breakout points to renewed bullish momentum and a possible continuation toward higher trendline targets. This structured advance indicates growing strength in DOGE’s market trend.
Dogecoin price support at $0.24 with cautious bullish signals
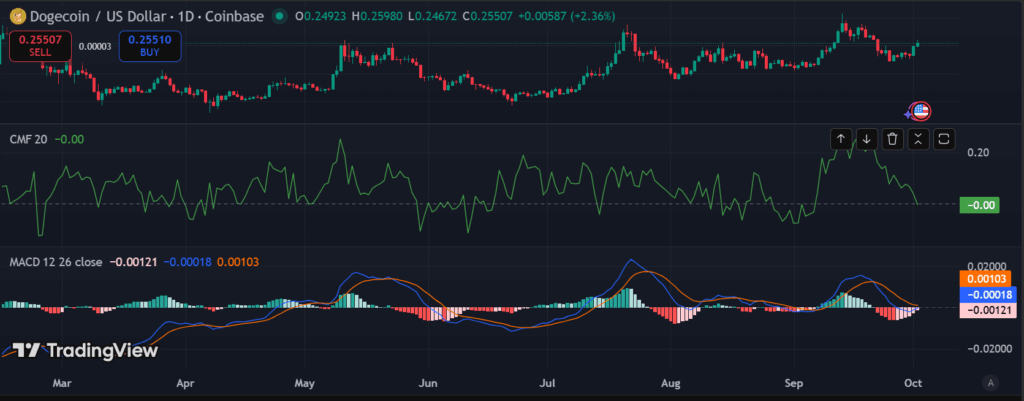
Dogecoin’s 1-day chart shows a mild upward bias after a period of sideways trading. The price has found strong support around $0.24, holding firm against recent pullbacks.
Resistance is seen near $0.26–$0.27, creating a key level that needs to be broken for further upside.

The MACD histogram has turned red with both the MACD and signal lines trending downward, reflecting weakening bullish momentum.
This hints at a potential bearish crossover if the trend continues. The CMF at –0.00 also shows mild outflows, meaning buying pressure is fading and fresh inflows are needed to revive upward momentum.

