
The crypto market is trading with a mix of red and green today, with the overall market capitalization hovering around $3.8 trillion and the fear and greed index hovers around 30 levels, indicating a bearish sentiment in the market.
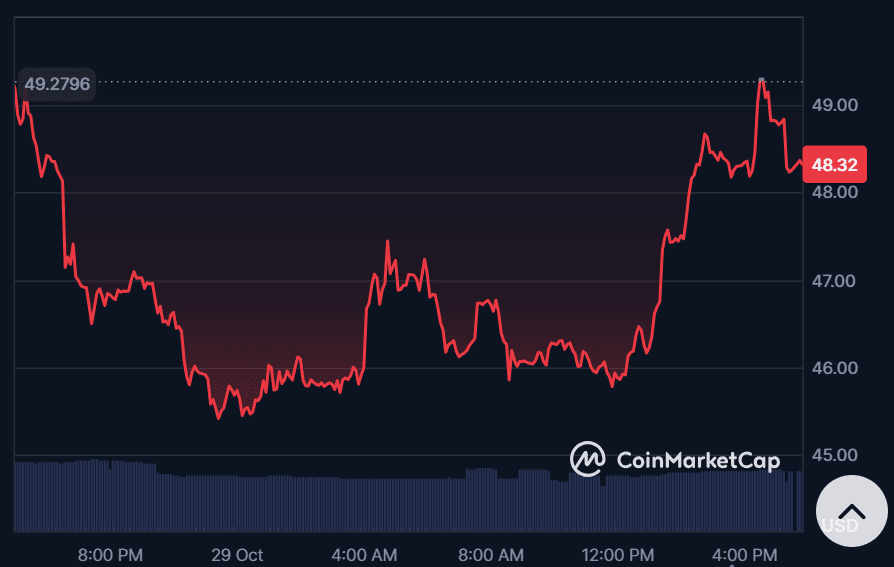
Dash has traded mostly sideways with notable volatility, dropping to around $46 before rebounding sharply toward the $49 mark.
The price recovery suggests renewed buying interest after an earlier sell-off phase.
As of this writing, the altcoin is exchanging hands at around $48.31 with a 24-hour gain of 0.09%.
According to analyst Butterfly, Dash has officially broken out of a long-term falling wedge pattern on the weekly timeframe, a setup that often signals a bullish reversal.
The pattern, which has been forming since mid-2021, shows a consistent series of lower highs and lower lows, gradually tightening before the recent breakout.
This clean break above the wedge’s upper boundary suggests that bearish momentum has been exhausted, giving bulls a strong technical advantage.
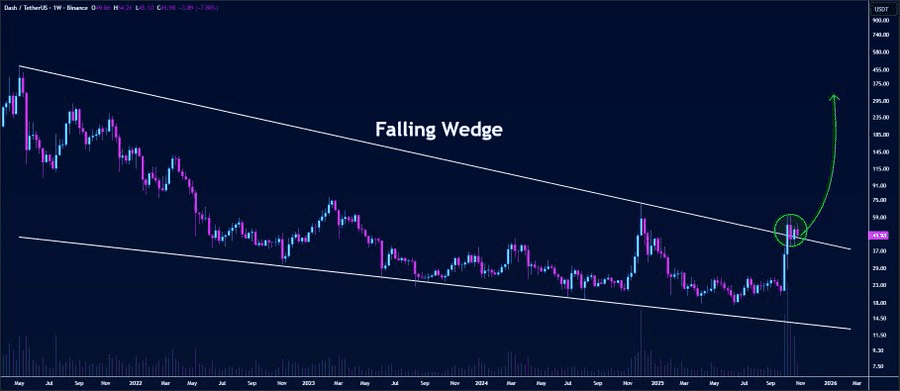
Butterfly noted that buying pressure is now building rapidly beneath the breakout zone, signaling renewed investor confidence.
With momentum picking up, DASH could continue its upward trajectory and potentially rally toward the $300 mark if volume and sentiment remain supportive.
This marks a significant shift for DASH after a prolonged period of consolidation and decline.
Dash consolidates below $50 as momentum Cools, but uptrend holds
Dash is showing signs of consolidation after a recent rally, currently trading around $48.26.
The price remains in a short-term uptrend as it continues to hold above the $45 support zone, while the next key resistance level lies near $50, above which a breakout could trigger further upside momentum toward $55.
However, failure to sustain above $45 may expose the token to lower support levels around $40, where buying interest could re-emerge and push the token further down towards the next support level at $42.62 according to CoinLore.
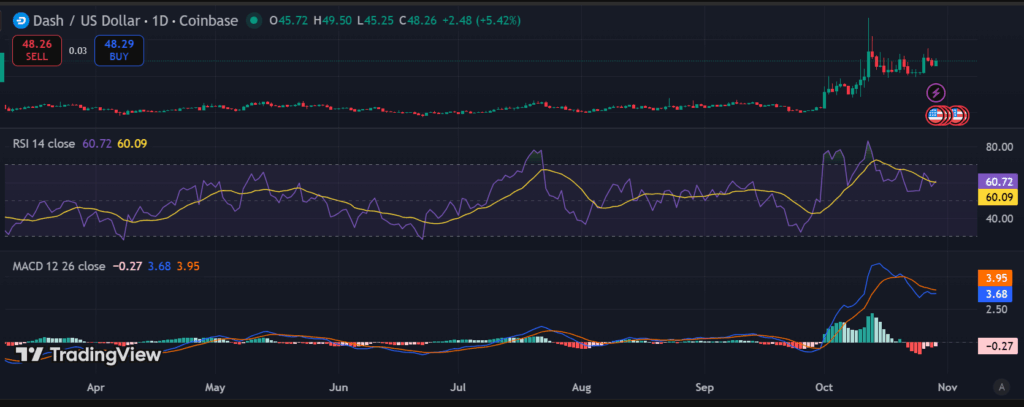
From the indicators, the RSI is at 60.72, slightly above the neutral zone, suggesting moderate bullish momentum but not yet overbought, indicating room for further gains.
The MACD shows the main line (3.68) just below the signal line (3.95), with a slightly negative histogram (-0.27), hinting at weakening bullish momentum and the possibility of short-term consolidation before the next move.