The crypto market is trading with a mix of red and green today, with the overall market capitalization hovering around $4.14 trillion.
Despite the mixed sentiment, the fear and greed index hovers around 50 levels, indicating a neutral sentiment in the market.
As of today, Chainlink has experienced a sharp dip before rebounding strongly to a peak near $23, showing strong buying momentum.
However, the price later retraced and faced resistance, gradually declining below $22.50.
As of this writing, Chainlink is exchanging hands at around $22.36 with a 24-hour loss of 0.50%.

Chainlink’s rising addresses signal bullish outlook
Ali, a crypto analyst known on social media as @ali_charts, highlights that Chainlink recorded 1,963 new addresses, reflecting a strong increase in network activity and user growth.
This surge in adoption comes as the LINK price hovered near $22.59, suggesting fresh participation is aligning with market stability and potential upside momentum.
The rise in addresses points to increasing investor confidence and expanding usage of the Chainlink ecosystem.
The chart further shows a consistent improvement in new addresses compared to previous weeks, reinforcing the bullish sentiment surrounding LINK’s long-term prospects.
Growing wallet creation is often seen as a sign of healthy network expansion, indicating more participants are engaging with the token.
If this trend continues, it could provide solid support for LINK’s price and set the stage for stronger future rallies.
Chainlink holds $22 amid tight range
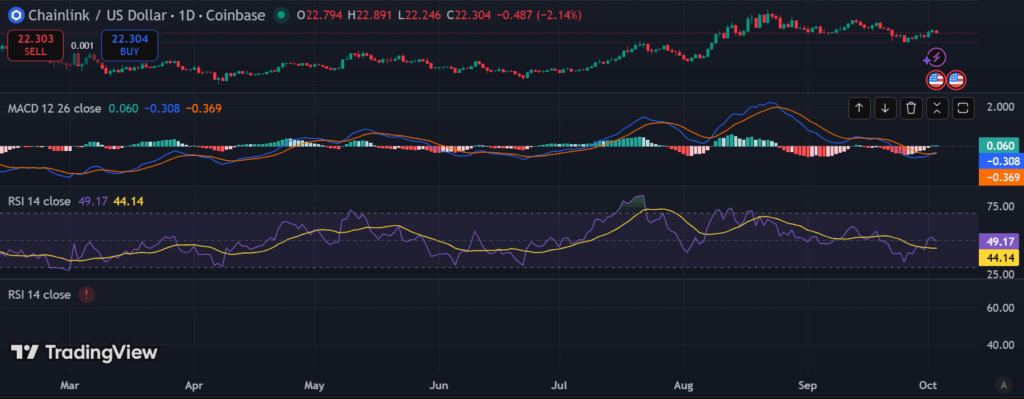
On the 1-day Chainlink chart, the price is currently trading around $22.30, showing slight weakness after testing the $23 area.
The recent candles suggest consolidation following a pullback from the highs.
The key support is forming near $22.00–$21.50, while the immediate resistance sits near $23.50–$24.00.
Overall, the market is ranging sideways with sellers defending resistance and buyers protecting support.

Looking at the indicators, the MACD is showing a near-neutral stance, with the MACD line (blue) hovering slightly above the signal line (orange), hinting at weak momentum and no clear dominance by bulls or bears.
Meanwhile, the RSI (relative strength index) is at 49.17, suggesting that the market is neither overbought nor oversold.

