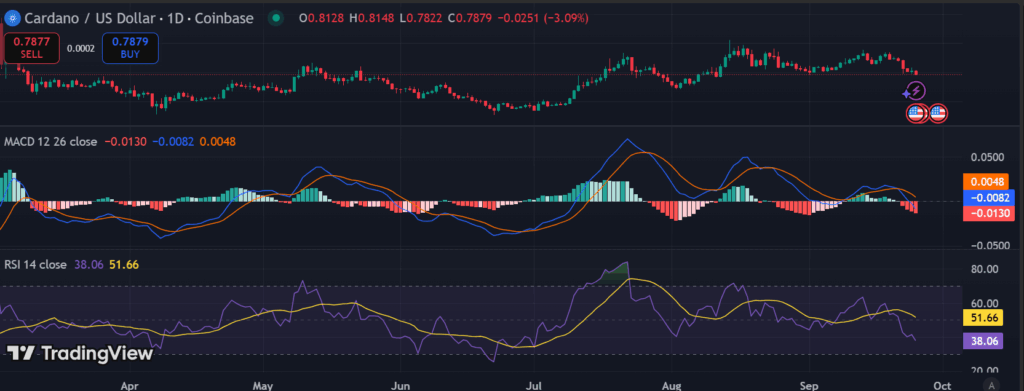
The crypto market has extended its decline, moving lower from recent highs today, with the overall market capitalization hovering around $3.83 trillion. Cardano showed early strength before facing resistance and reversing lower. The trend shifted into a steady decline with persistent selling pressure.
As of this writing, Cardano is exchanging hands at around $0.7927 with a 24-hour loss of 2.9%.

ADA must hold $0.80 for a move to $0.95
Ali, a crypto analyst known on social media as @ali_charts, highlights that Cardano (ADA) is maintaining critical support around the $0.80 level. The chart shows that as long as this floor holds, buyers could regain control and push the price toward higher resistance levels.
A successful rebound above intermediate zones near $0.85 and $0.87 could open the path for a larger rally targeting $0.95. This setup suggests that ADA is at a key inflection point, where holding support is essential to confirm a bullish continuation.
Cardano battles key support as resistance levels loom
Cardano has recently tested crucial support at $0.78, a level that holds to prevent further downside pressure. This zone has acted as a stabilizing point, with repeated touches suggesting strong buyer interest. A failure to stay above could expose the token to deeper declines, while maintaining this support would help consolidate strength.

On the upside, immediate resistance sits at $0.814, followed by a stronger barrier near $0.8244. Breaking above these levels would indicate renewed bullish momentum and potentially open the way for higher price action. Until then, ADA remains range-bound, with traders closely watching if buyers can defend the $0.78 floor.
Cardano faces bearish pressure as $0.78 support comes into play
The 1-day Cardano chart shows a bearish trend, with the price sliding toward support around $0.78 after failing to hold higher levels. Resistance is now seen near $0.82, where previous attempts to rebound have faced rejection, leaving the market under pressure.

Looking at the indicators, the MACD shows bearish momentum as the signal line crosses below the MACD line, while red histogram bars continue to grow. The RSI sits at 38, nearing oversold territory, suggesting sellers are in control but also hinting that a potential relief bounce could emerge if support holds.

