
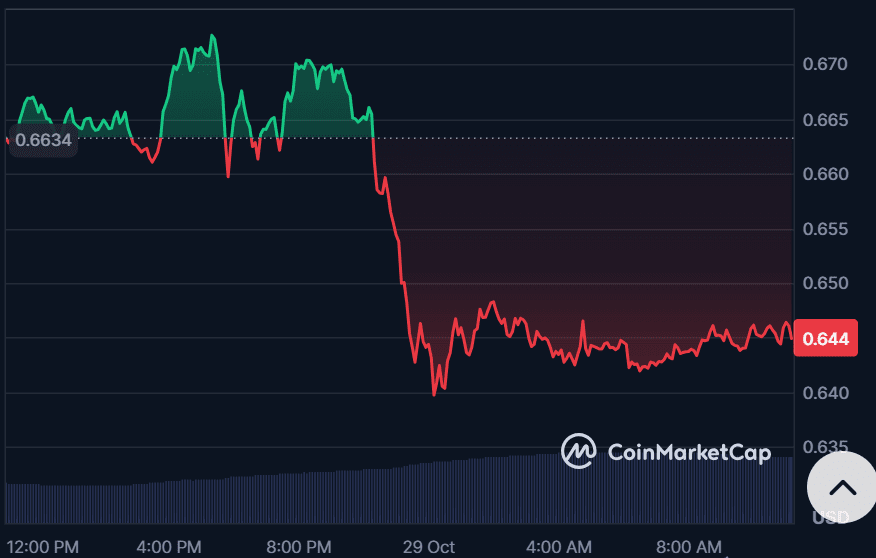
Cardano’s price is showing bearish momentum, trading around $0.646 after facing strong selling pressure.
Buyers are struggling to hold support, suggesting limited strength in the current range.
If the weakness persists, ADA could retest lower zones before attempting any potential recovery.
As of this writing, the cryptocurrency is exchanging hands at around $0.6450 with a 24-hour loss of 2.72%.
Recent market data by analyst Ali Martinez, Cardano is forming a large symmetrical triangle pattern, a setup that typically signals a period of consolidation before a major breakout.
The chart is showing that ADA has been oscillating within this tightening range for months, with lower highs and higher lows converging toward a critical apex.
Martinez highlighted that the $0.80 resistance level is the key barrier to watch; a breakout above it could confirm the end of consolidation and trigger a strong bullish movement.
Once ADA breaches the $0.80 threshold with convincing volume, Martinez projects a potential rally that could propel prices toward the $1.70 region.
The symmetrical triangle’s measured move supports this bullish target, the expected price surge based on the pattern’s height.
A move would reflect renewed investor confidence and possibly signal the start of a broader recovery phase for Cardano, especially if market sentiment in the crypto sector turns favorable.
Cardano struggles to break above key resistance at $0.80
According to analyst Mr. Brownstone, Cardano’s current price structure is suggesting a lack of impulsive momentum, indicating that a confirmed bullish breakout is not yet underway.
The chart illustrated a complex corrective pattern with overlapping waves, where ADA has struggled to break above key resistance lines near $0.80.
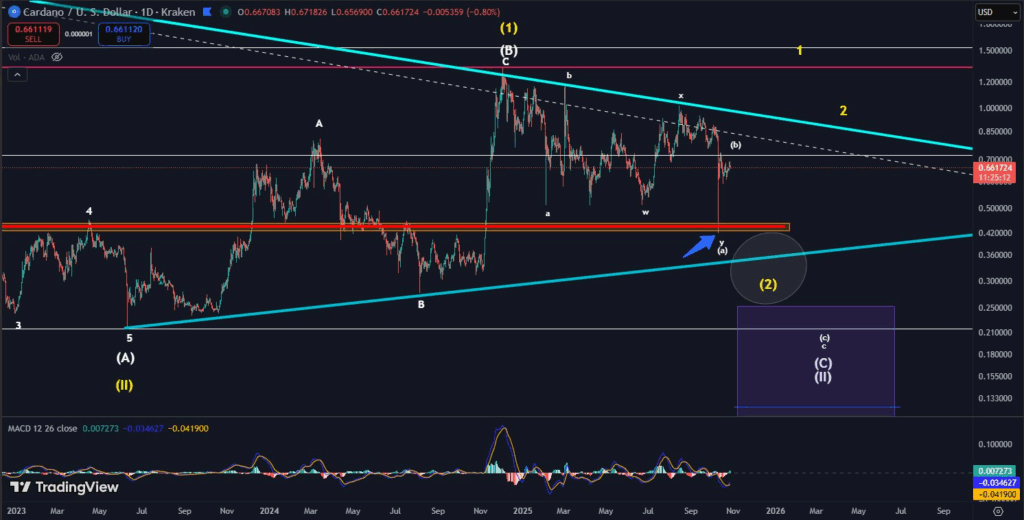
The Elliott Wave counts presented, in both yellow and white, reflect two potential scenarios: a bullish continuation if ADA breaks higher, or a deeper correction if bearish momentum prevails.
The recent sideways and downward price action supports the latter view for now.
If the bearish scenario unfolds, ADA is expected to retrace toward the sub-$0.40 range, aligning with the projected Wave (2) correction zone.
This would represent a continuation of the broader corrective phase before any significant recovery could begin.
The MACD indicator at the bottom also reinforces the cautious outlook, showing limited bullish momentum.
The pattern evolves, the distinction between the yellow (bullish) and white (bearish) counts will become clearer, revealing whether ADA can recover strongly or continue its descent into a deeper corrective wave.