
Bitcoin price has remained locked in a narrow range as traders assess the next decisive move. Market activity reflects hesitation, with momentum lacking on both sides.
Participants continue to monitor key levels for confirmation of direction. The current phase signals a buildup that could lead to a stronger breakout.
Bitcoin currently trades near $66,900, marking an 8% decline over the past month.
The asset has stayed between $60,000 and $74,000 since hitting its yearly low on February 6. Market participants continue to watch this range as price action remains constrained.
Analysts highlight key levels as Bitcoin price lacks direction
Michael van de Poppe, founder of MN Trading Capital, stated on X that Bitcoin shows no clear direction. He explained that prolonged consolidation often leads to a stronger breakout.
He noted that a move above $71,000 could signal renewed momentum. Bitcoin last reached that level on March 26.
Market observer Ted shared a cautious outlook on X. He argued that the $60,000 level did not mark the true bottom.
He expects a final capitulation before a stable base forms. He highlighted resistance between $69,000 and $70,000, which previously acted as support.
He warned that a drop below $65,000–$66,000 could trigger another decline.
Institutional flows and market structure signal uncertainty
Institutional activity shows mixed sentiment, adding pressure to Bitcoin price movement. Spot Bitcoin ETFs recorded $173.73 million in withdrawals on Wednesday.
This ended a two-day inflow streak and reflected growing caution. Institutional investors appear to be stepping back amid ongoing volatility.
Glassnode reported that Bitcoin remains in a redistribution phase. The firm noted that a large share of supply still sits at a loss. It added that long-term holders continue to reduce positions. Glassnode concluded that the market no longer faces extreme stress but lacks strong conviction.
Trader Jordan presented an optimistic scenario on X. He projected a potential rise toward $80,000 based on the current trend.
He observed that Bitcoin has held support in the lower $60,000 range during repeated tests. He suggested that maintaining this support could drive prices toward the $80,000–$84,000 CME gap.
Bitcoin price continues to reflect uncertainty as opposing views shape expectations. Traders remain focused on key resistance and support zones for confirmation.
The market now waits for a decisive move to define the next trend.
Bitcoin market outlook
The 1-day Bitcoin price chart shows a bearish trend, with the price consolidating sideways after a sharp drop and failing to establish strong upward momentum.
The current price stands around $66,963, up by 0.01% change, indicating a flat session and limited market movement.
The RSI (14) sits around 43–45, indicating weak momentum and slightly bearish conditions, as it remains below the neutral 50 level.
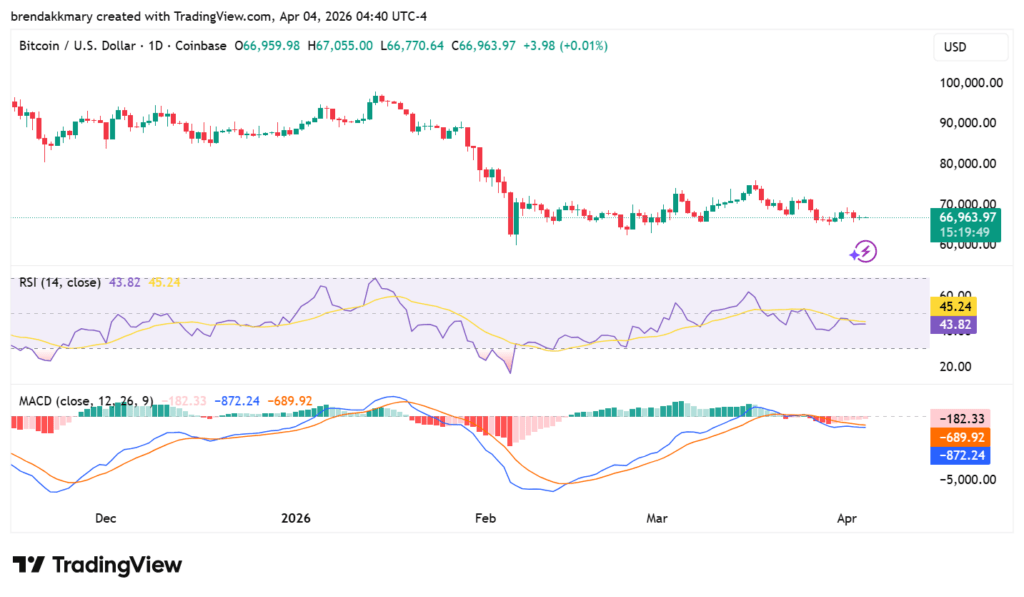
The MACD remains below the signal line in negative territory, with a fading histogram, signaling persistent downside pressure despite consolidation.