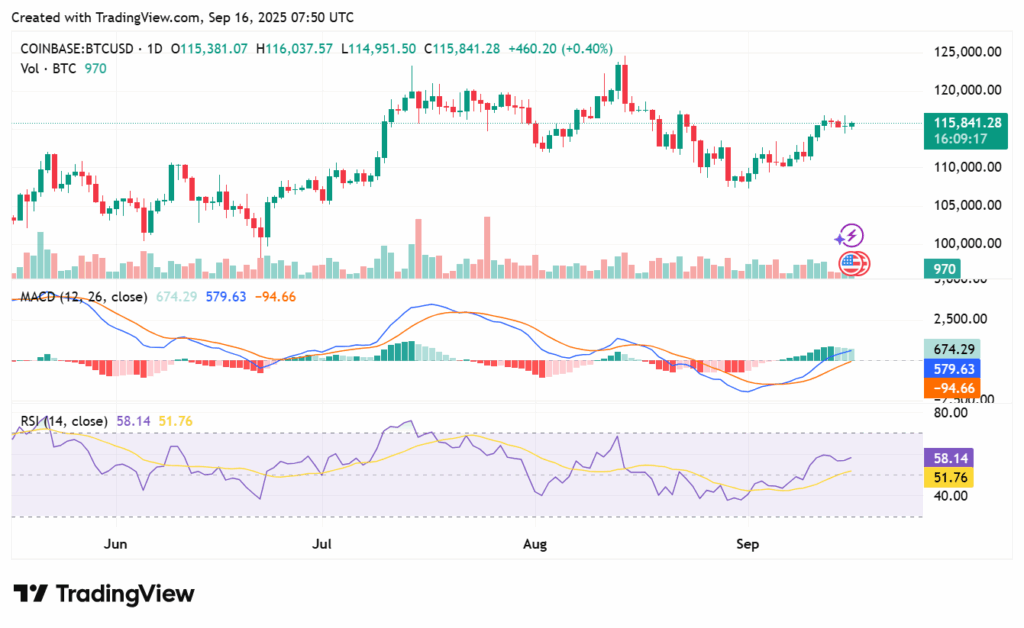
The crypto market is trading with a mix of red and green today, with the overall market capitalization hovering around $4.02 trillion.
Despite the mixed sentiment, the fear and greed index hovers around 50 levels, indicating a neutral sentiment in the market.
Bitcoin has dropped below the 116k level after a steady uptrend observed over the last week. However, the BTC is showing signs of rally continuation as the selling pressure eases.
As of this writing, the BTC is exchanging hands at around $115,69 with a 24-hour gain of 0.50%.

Bitcoin is currently consolidating just below the $117,200 resistance level as traders await tomorrow’s FOMC meeting, which is expected to dictate the market’s next direction, according to Ted on X.
A successful reclaim of the $117,200 level could open the door for a new all-time high, while losing the crucial $113,500 support zone would likely trigger a new monthly low.
Sell-side risk ratio hits zero, signaling Bitcoin market bottom
Data from Glassnode shows the sell-side risk ratio has touched the zero line for the first time in months. This indicator compares the value realized by sellers with Bitcoin’s market value. A zero reading historically marks periods when sellers have fully exited, leaving room for buyers to regain control.
Ali, a crypto analyst known on social media as @ali_charts, highlights that the latest zero reading is significant. He notes that such levels have historically preceded sharp upward moves. According to him, the risk-to-reward ratio now favors accumulation, rather than additional selling.
Technical analysis – will BTC price rally continue further?
The Relative Strength Index (RSI) indicator is hovering around 58.14, indicating that the market is neither overbought nor oversold. Bitcoin is in a neutral-to-positive zone, suggesting there’s still room for upward movement before hitting overbought levels.

The Moving Average Convergence Divergence (MACD) is showing a bullish signal, as the blue MACD line (671.40) has crossed above the orange signal line (576.02), supported by rising green histogram bars that reflect strengthening upward momentum. This suggests that buyers are regaining control and could push the price higher in the short term.

