
Bitcoin has climbed beyond the $68,000 level on April 1, 2026, gaining over 2%. The asset recovered from intraday lows below $66,000.
The move followed shifting market sentiment tied to easing geopolitical concerns. Bitcoin extended gains as global markets reacted to diplomatic signals from Iran.
Masoud Pezeshkian said his administration had “the necessary will to end this war.” He stated Iran would consider de-escalation if it received security guarantees.
These remarks, though unverified, shifted investor sentiment. Traders had feared expanded conflict could disrupt oil supply routes.
That risk had also driven inflation concerns across markets. As a result, Bitcoin benefited from renewed risk appetite.
Bitcoin leads equity surge as risk appetite improves
US equity markets recorded strong gains during Tuesday’s session. The Nasdaq rose about 3.1%.
The S&P 500 advanced 2.91%. Each major index posted its strongest performance in over 30 days. Futures extended gains into Wednesday’s pre-market session.
S&P 500 futures added 0.4%. Nasdaq 100 futures climbed 0.6%. Dow futures increased 0.3%.
Coinbase shares gained more than 6%. Robinhood advanced around 5%. These gains reflected stronger confidence in digital asset exposure.
Gasoline prices have increased roughly 35% since tensions involving Iran escalated. This rise continues to affect consumer costs and broader sentiment.
Oil prices decline as supply concerns ease
Oil markets moved lower as geopolitical risks appeared to ease. Brent crude dropped more than 2.9% to around $104 per barrel.
West Texas Intermediate declined before stabilizing slightly above $100. Prices had traded near $105 before the diplomatic signals emerged.
The decline reflected reduced fears of supply disruptions through the Strait of Hormuz. This route remains critical for global oil flows.
Meanwhile, Donald Trump indicated the conflict would not continue “much longer.” He suggested the United States could pursue an end to hostilities even if the Strait remains inaccessible.
These signals from both Iranian and US leadership drove market momentum. Investors now focus on upcoming economic data.
Key releases include retail sales, ADP employment figures, and ISM manufacturing data. These reports will provide clarity on US economic conditions at the start of the new quarter.
Bitcoin analysis: Consolidation near $68.6K amid weak momentum
The daily chart of Bitcoin shows an uptrend structure transitioning into a bearish structure. Price reached a high near $120,000 before forming a series of lower highs and lower lows.
This confirms that selling pressure has taken control of the market structure. A sharp drop pushed the price toward the $70,000 zone, where it later stabilized.
At the time of writing, Bitcoin price is trading at $68,606, reflecting an increase of 0.57% change on the day.
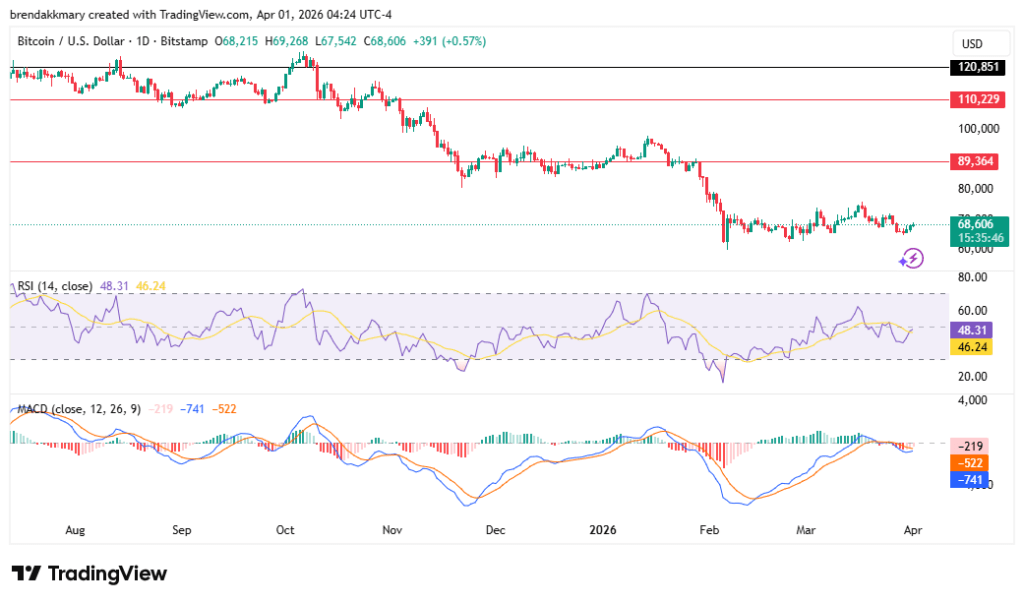
The Relative Strength Index (RSI) is near 48, slightly below the neutral level of 50. This indicates weak momentum and limited buyer strength.
The MACD line remains below the signal line, but the gap is narrowing. Histogram bars are still negative, though they are gradually decreasing in size. This suggests that selling pressure is slowing down.