The crypto market is trading with a mix of red and green today, with the overall market capitalization hovering around $3.64 trillion. AAVE has dropped about 15.8% over the past week, falling from around $257 to $216.
As of today, AAVE traded around $216, slipping slightly after failing to maintain momentum above $230. The token briefly rebounded after an early decline but failed to sustain upward momentum.
Overall, AAVE’s market sentiment remains bearish, with support near $210 and resistance around $230. The token shows signs of mild bearish pressure, with sellers keeping control near the $215–$220 range.
As of this writing, the Altcoin is exchanging hands at around $216.28 with a 24-hour loss of 2.05%.

AAVE bears gain control amid mounting sell pressure
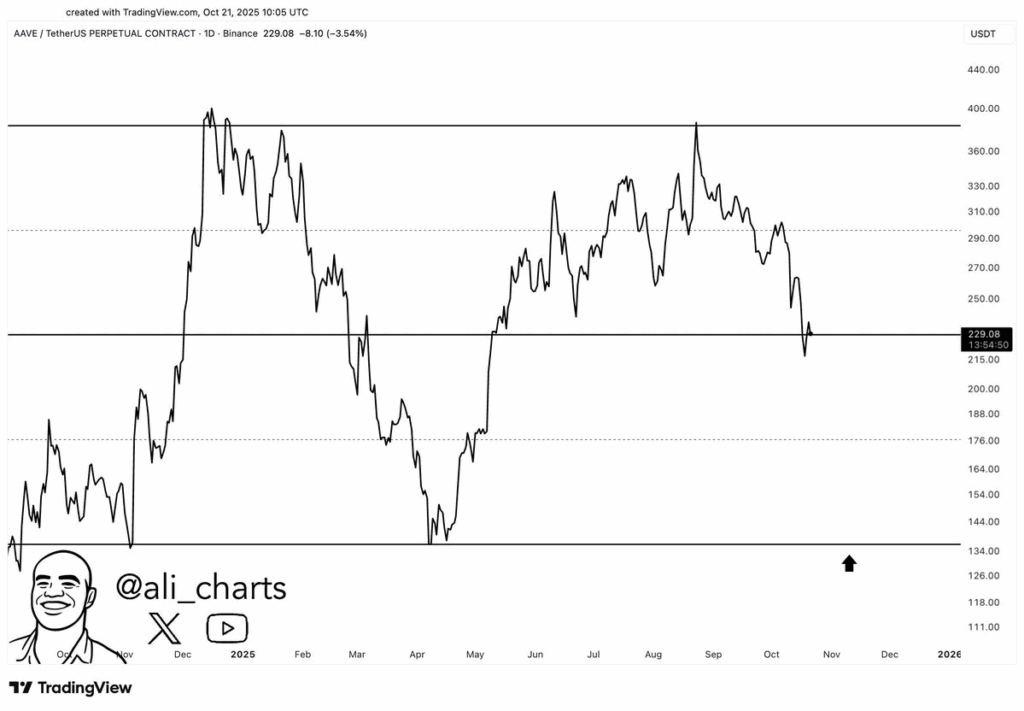
Recent data from analyst Ali Martinez indicates that AAVE’s current price action exhibits a clear bearish structure, as the token struggles to maintain above the $230 support zone.
The chart indicates repeated rejections from the mid-range levels near $300, confirming strong selling pressure from traders who appear to be exiting their positions.
This breakdown below the key support area suggests growing weakness in momentum, with bears now in control of the short-term trend.
Martinez highlighted that the next significant demand zone lies around $135, which aligns with the previous major reversal level seen earlier in the year.

If the ongoing downward pressure persists, AAVE could be magnetically drawn toward this lower support, completing a full retracement of its recent bullish cycle.
However, a decisive rebound above $250 would be needed to invalidate this bearish outlook and restore buyer confidence.
AAVE extends bearish momentum as indicators signal weak recovery
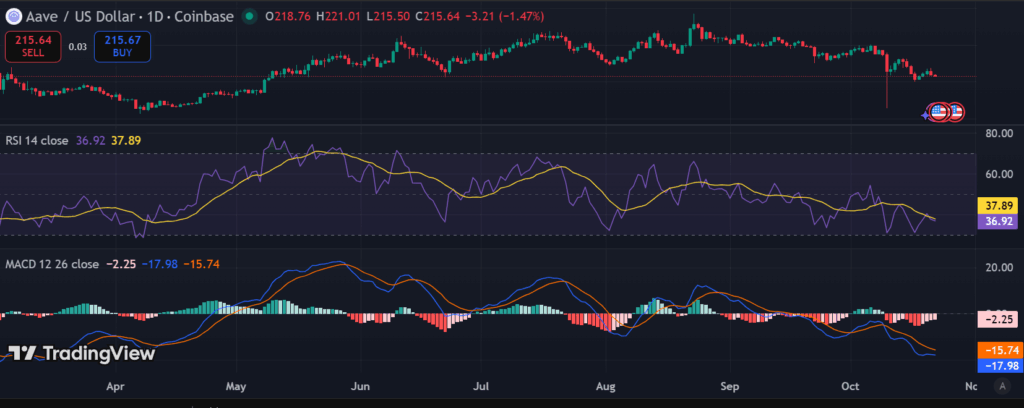
AAVE’s 1-day price chart is showing a clear bearish trend, with the token consistently posting lower highs and lows.
The recent decline below the $230 mark confirms sustained selling momentum, while the next key support level sits near $210, a crucial area for potential buyers.
If bearish momentum continues, the price could test the $200–$190 zone, while a rebound could face immediate resistance around $230 and a stronger barrier near $250.

The Relative Strength Index (RSI) is hovering around 37, indicating that AAVE is approaching the oversold territory, which signals weakening buyer strength.
Meanwhile, the MACD shows a strong bearish crossover, with the MACD line remaining below the signal line and the histogram showing persistent red bars,confirming negative momentum.

